Pivoting Around Memory
06 Apr 2019 Tagged: securityWhen exploiting a program, there’s four primary regions of memory that matter to us:
- The program itself
- The stack
- libc
- The heap
All of these may be at randomized addresses, but a complex exploit will often need to interact with each of them. So how can we figure out where all of these are?
It turns out that if you have an arbitrary memory read and a pointer to any one of the four regions (or a relative read inside a region and the address you’re reading relative to) it’s actually possible to pivot around and leak the addresses of all of the other regions.
To start with, lets cover some methods you may be familiar with:
libc from binary: reading GOT entries
In the case a binary is not position-independent or you have a leak of the program base, GOT entries are a super simple way to leak libc’s address, opening up an entire realm of exploits available inside of libc itself.
libc <-> heap: reading main_arena pointers
If you have an arbitrary heap read (or, in some cases, just a read after free), you can often get pointers into libc by reading memory in the heap that points into the main_arena in libc. You’ll typically see these as the last next pointer in freelists.
Going the other way, if you have a read inside of libc, you can read out of main_arena to get pointers into the heap.
Program base and/or libc from stack: reading return addresses
If you have the ability to read on the stack, you can leak function pointers by reading out the return addresses. This will yield either function pointers to the program itself (defeating PIE), to libc (giving you libc base), or to other libraries which could be useful as part of an exploit chain.
These three methods can get you pretty far, but there’s a few lesser known strategies which give you the last missing “edges” that you need to get from any region to any other region:
Stack from libc: __libc_argv or environ
Given you have a read inside libc, you can leak an address on the stack by reading out of the __libc_argv or environ symbols.
These typically point to memory very high up the stack, and there is often some randomization in the distance between this data and the current RSP.
Nevertheless, this does leak a pointer on the stack, and you can iteratively walk down the stack until you hit the return address pointing into __libc_start_main to locate where the “important” stack data starts.
Program base from libc: pivoting through ld
As far as I know, there are no pointers in libc itself that store pointers into the program, so we have to go through another layer of indirection to leak the program base.
The dynamic linker, ld, is effectively always loaded, and libc always contains pointers into it for runtime symbol resolution (in the form of the _dl_runtime_resolve libc GOT entry). ld is also practically guaranteed to be at a constant offset from libc due to the way mmap works and the fact that ld and libc are almost always the first libraries to be loaded by a program, and therefore the first things to be mmaped.
Either way, once the address of ld has been leaked, the name field of the global _dl_rtld_libname struct holds a pointer into the .interp section of the main binary (specifically it points to the string with the path to the expected linker), thus leaking the program base address.
Conclusion
As a helpful reference, I’ve compiled all of the above techniques into a simple flow chart:
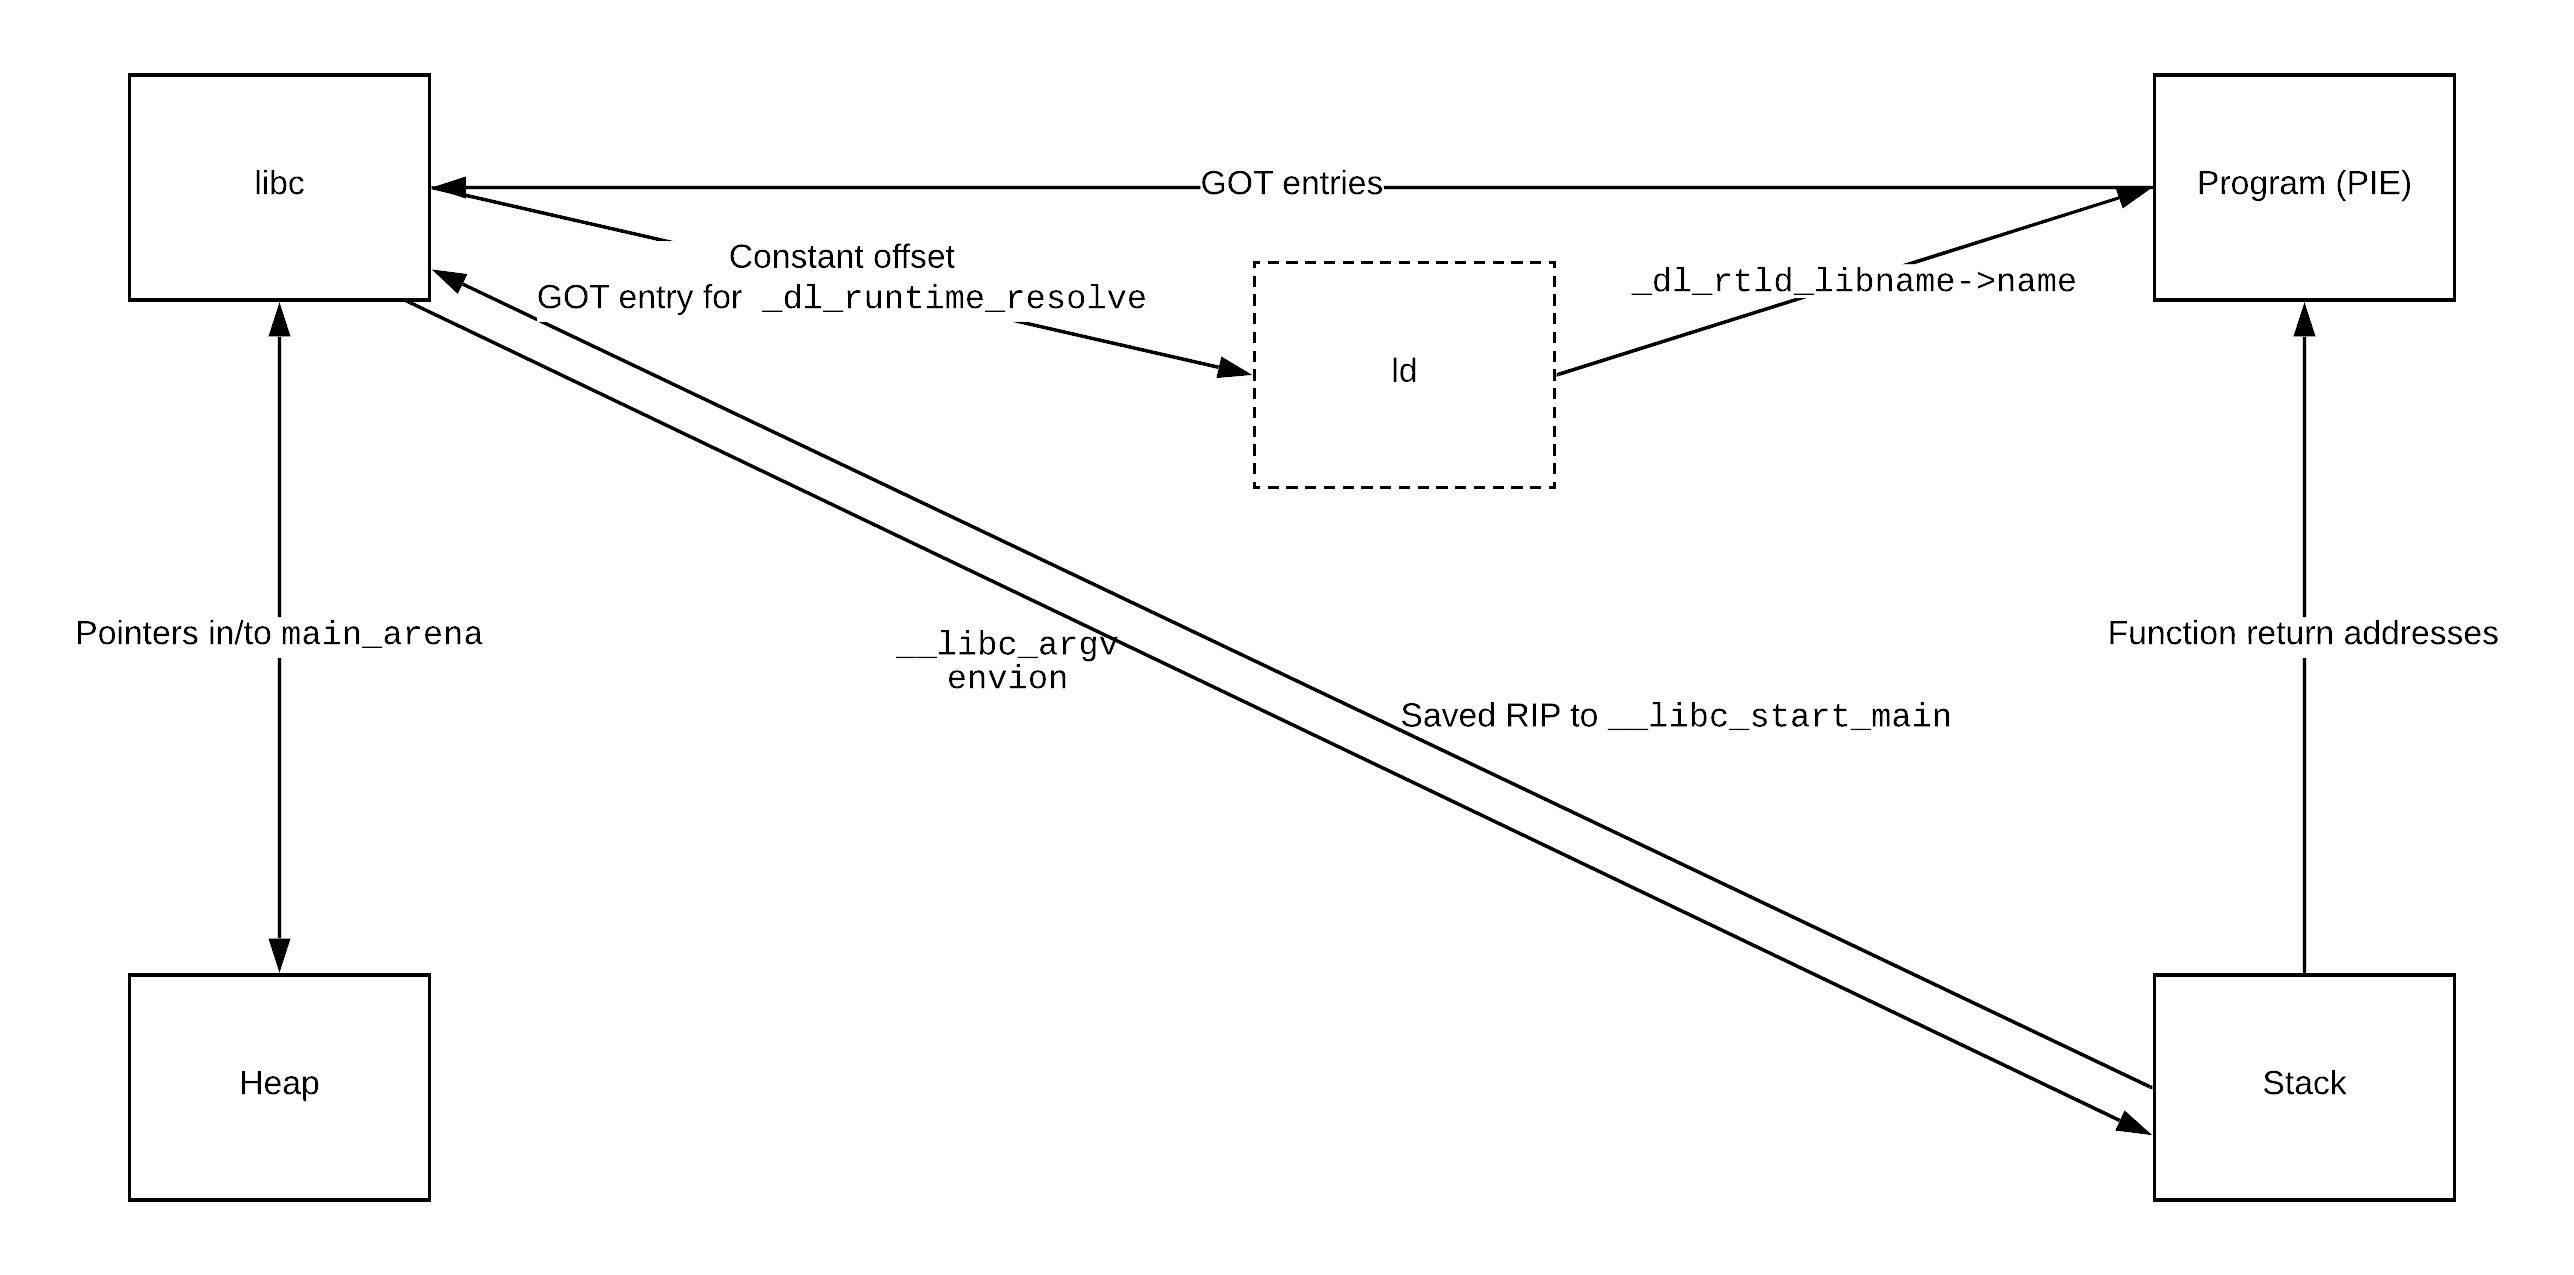
Given one of the four starting regions, just follow the arrows to leak whatever other region(s) you want.
Of course this doesn’t include binary-specific leaks (e.g. a heap pointer stored in the program’s globals), but these methods should work for just about any Linux binary.
